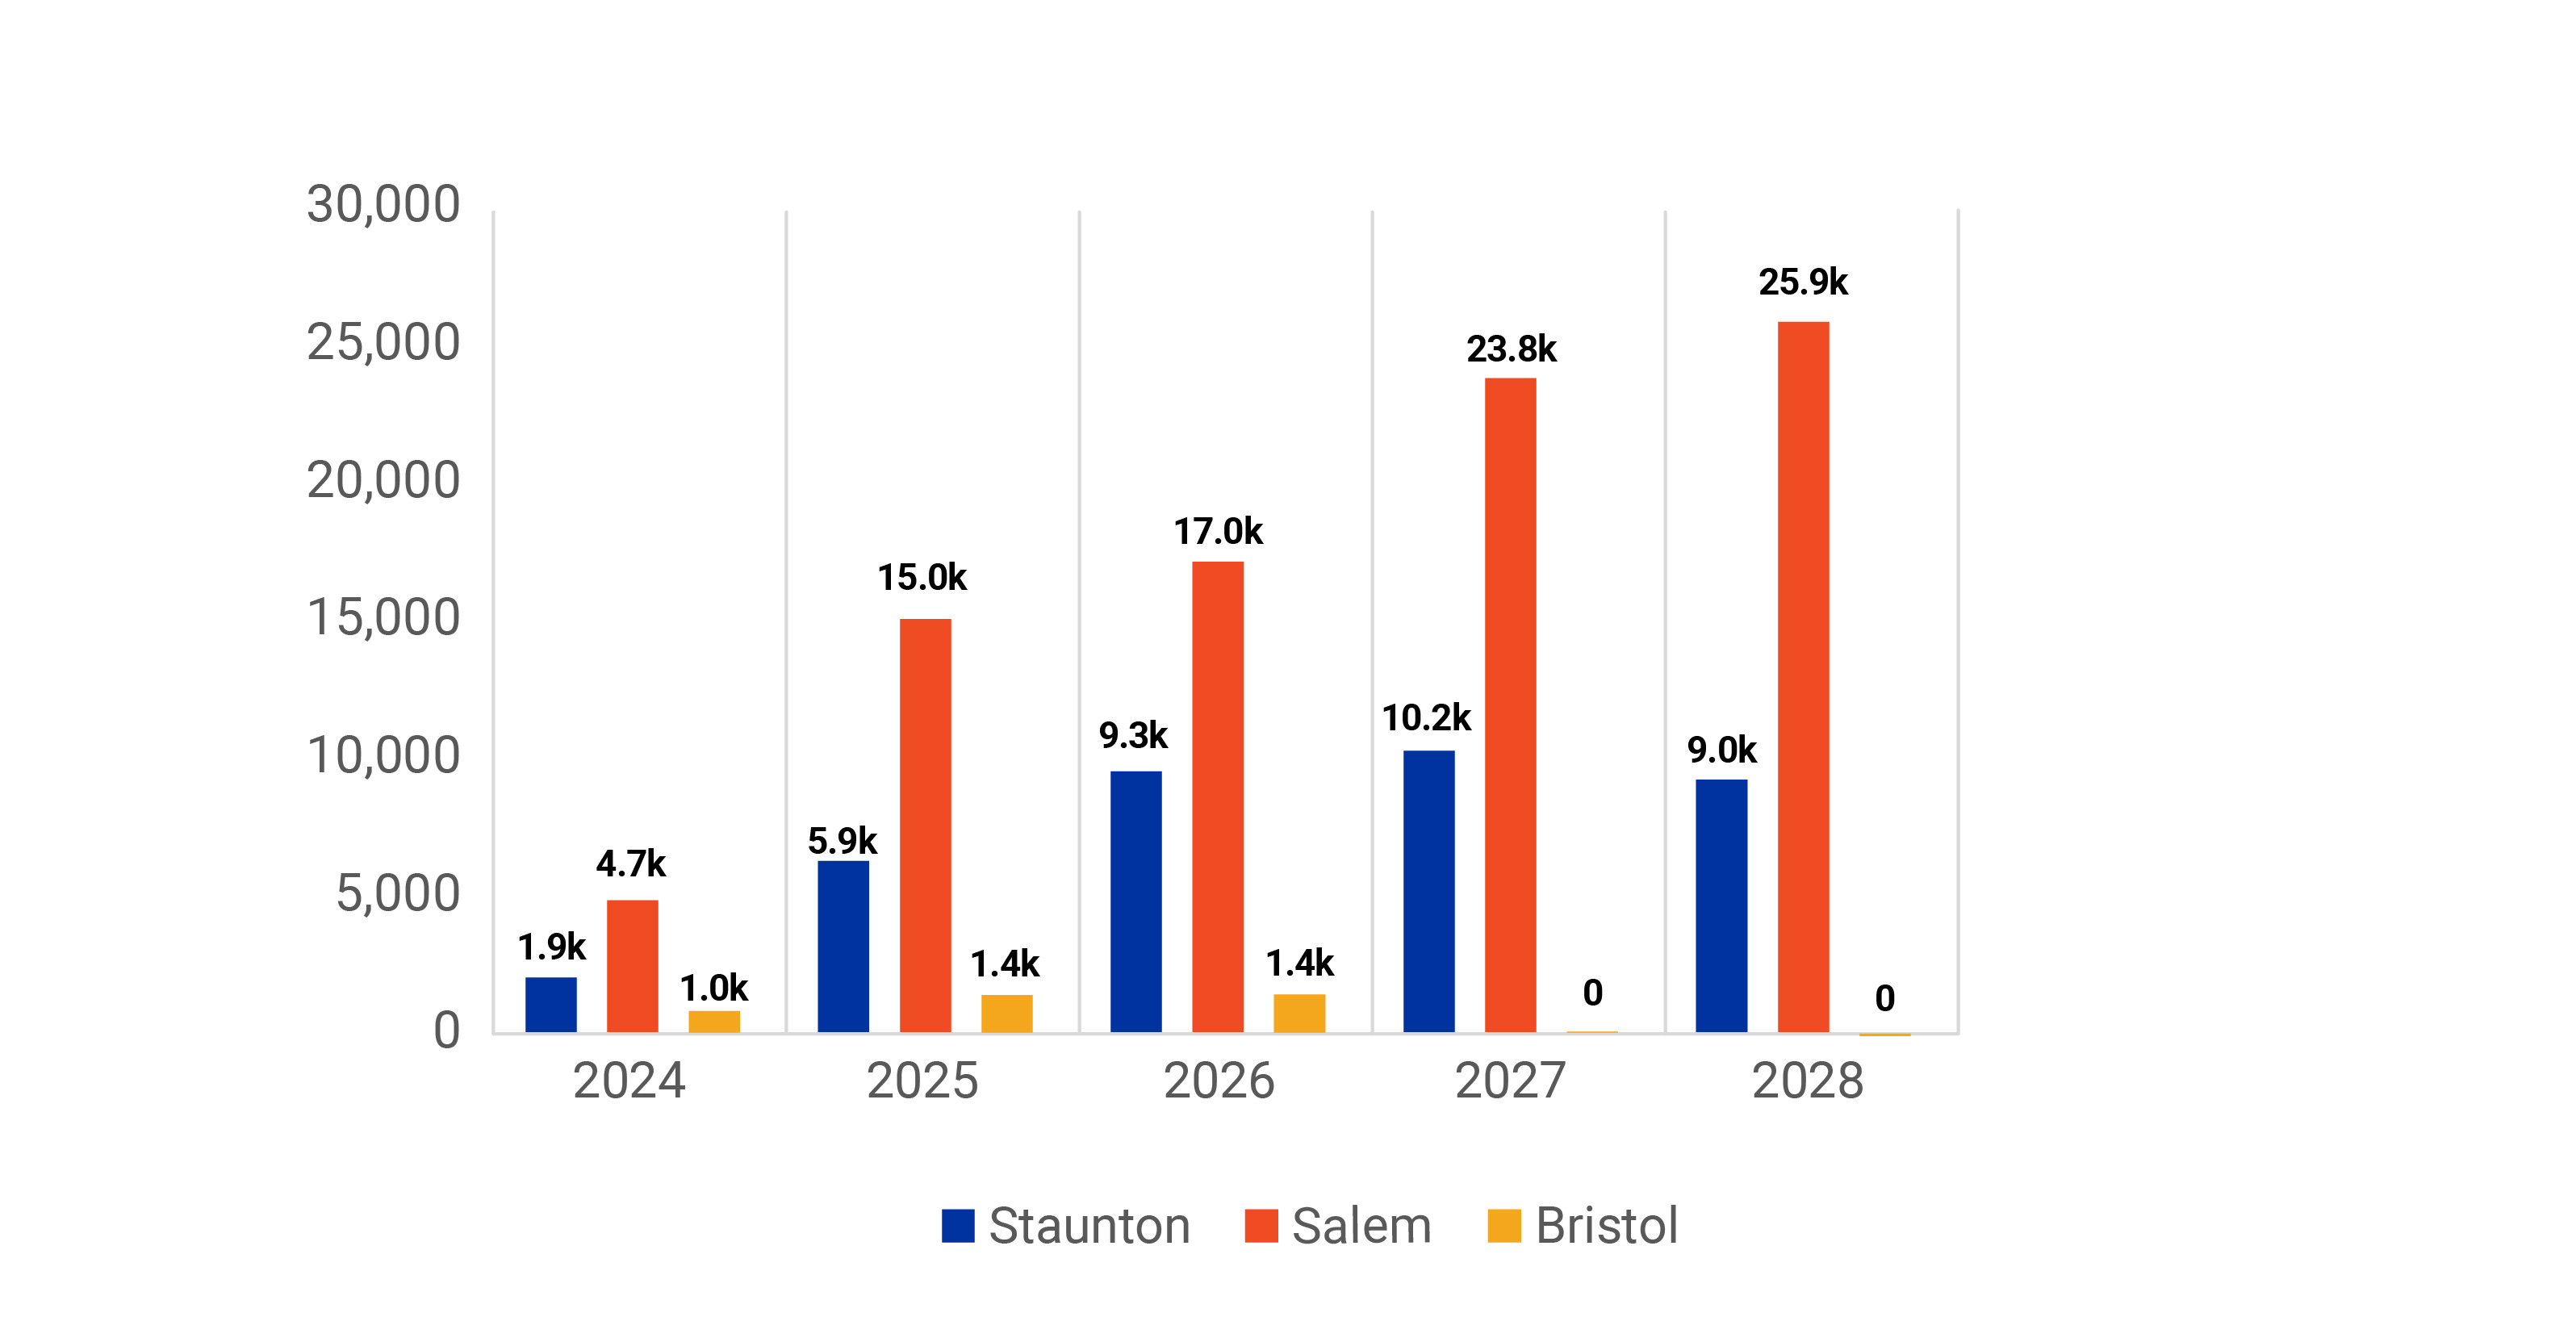
Materials Estimates
Five Year Outlook
Major items summary
|
Material
|
2024
|
2025
|
2026
|
2027
|
2028
|
|
Asphalt (ton)
|
71,900
|
168,900
|
205,100
|
253,500
|
256,000
|
|
Aggregate (ton)
|
52,800
|
123,400
|
157,700
|
176,300
|
182,800
|
|
Pipe (linear feet)
|
7,630
|
22,360
|
27,800
|
33,910
|
34,900
|
|
Guardrail (linear feet)
|
16,300
|
31,200
|
35,800
|
44,500
|
44,400
|
| Material |
2024 - 2028 |
| Structures (each) |
46 |
« Back to intro screen
Major Quantities Corridor-Wide
Calendar Years 2024 - 2028
|
Item
|
Bristol Details
|
Salem Details
|
Staunton Details
|
Grand Total
|
|
Category
|
Item Description
|
Unit
|
Quantity
|
|
Drainage
|
Box Culvert (Any Size)
|
linear feet
|
0
|
1,890
|
660
|
2,550
|
|
Conc. Pipes Under 36"
|
linear feet
|
2,830
|
68,910
|
30,620
|
102,360
|
|
Conc. Pipes Over 36"
|
linear feet
|
1,070
|
13,830
|
3,280
|
18,180
|
|
Jacked & Bored Pipes Under 36"
|
linear feet
|
0
|
1,540
|
1,360
|
2,900
|
|
Jacked & Bored Pipes Over 36"
|
linear feet
|
0
|
350
|
260
|
610
|
|
Manhole & Inlets
|
linear feet
|
11
|
680
|
390
|
1,081
|
|
Endsection & Endwalls
|
linear feet
|
60
|
340
|
220
|
620
|
|
Curb And Gutter
|
ton
|
1,020
|
7,060
|
7,040
|
15,120
|
|
Pavement
|
Asphalt (Any Type)
|
ton
|
50,400
|
557,900
|
347,100
|
955,400
|
|
Aggregate
|
linear feet
|
121,900
|
369,300
|
201,800
|
693,000
|
|
Traffic and Safety
|
Guardrail (Any Type)
|
linear feet
|
11,300
|
72,100
|
88,800
|
172,200
|
|
End Treatment (Any Type)
|
linear feet
|
90
|
180
|
230
|
500
|
|
Concrete Barrier - Temporary
|
linear feet
|
19,000
|
539,500
|
307,500
|
866,000
|
|
Concrete Barrier - Permanent
|
linear feet
|
6,300
|
49,200
|
40,000
|
95,500
|
|
Structures
|
*Bridge ( Deck Area)
|
square feet
|
59,300
|
121,800
|
201,600
|
382,700
|
|
Noise Barrier Wall
|
square feet
|
0
|
437,000
|
369,600
|
806,600
|
|
Retaining Wall
|
square feet
|
8,000
|
29,500
|
6,300
|
43,800
|
|
|
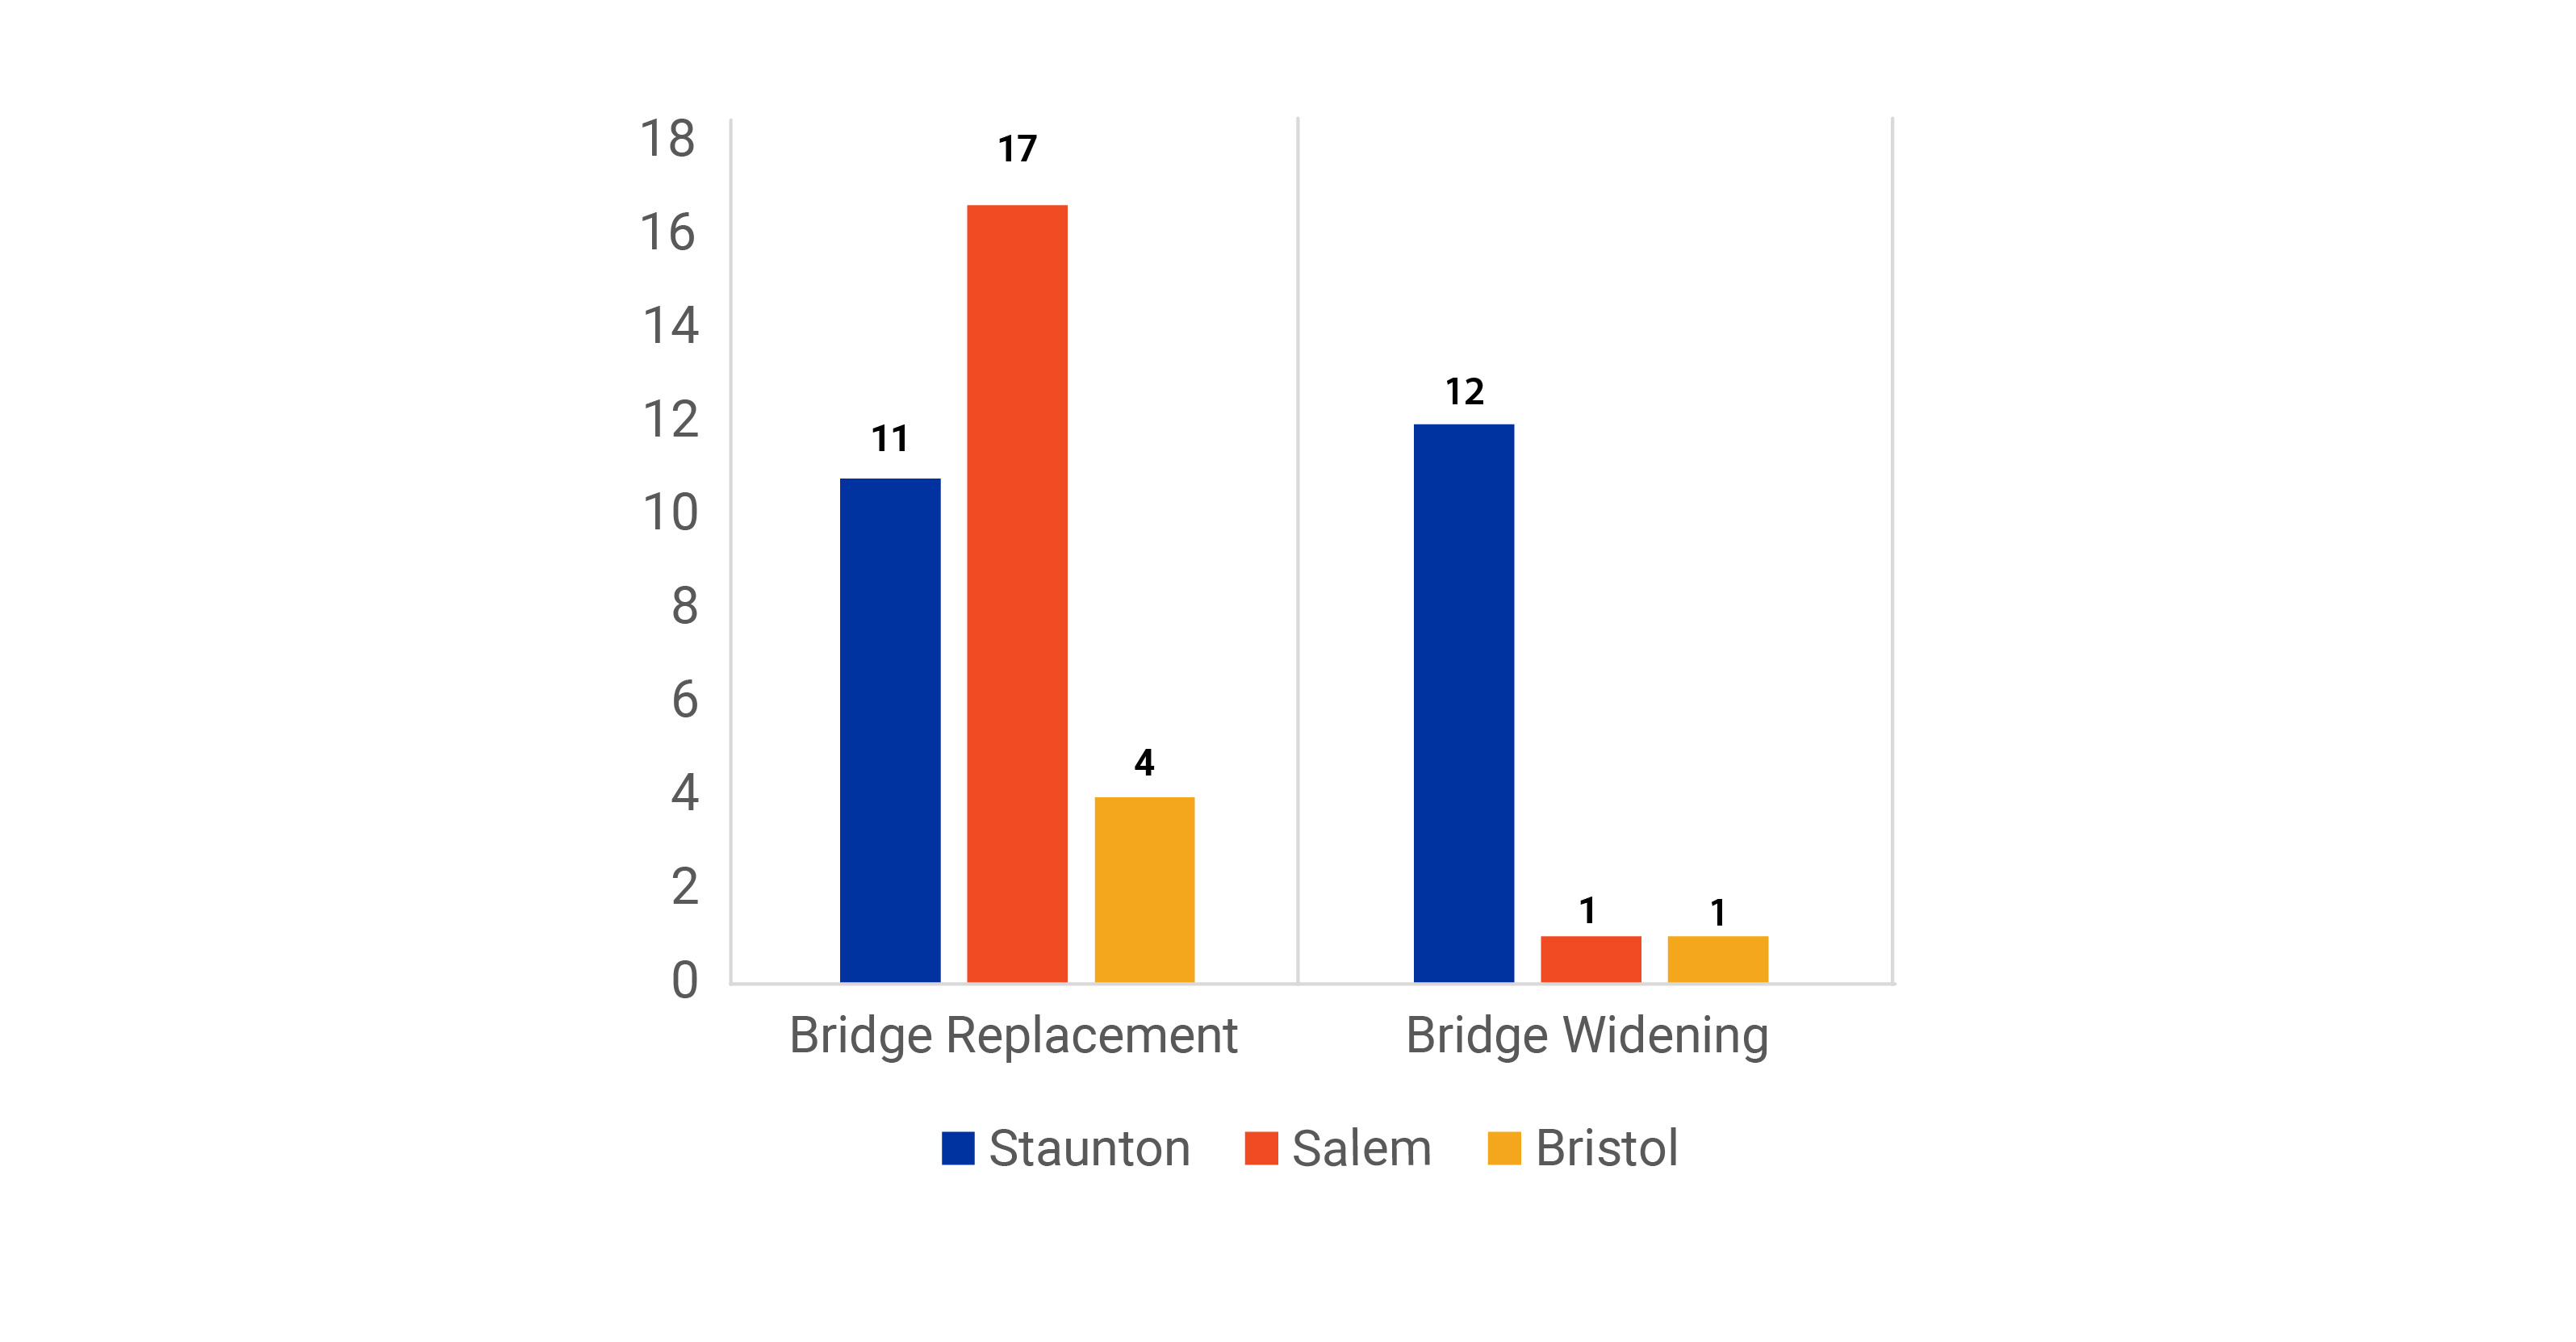
*Number of bridges for
|
|
Bridge Replacement
|
Bridge Widening
|
|
Bristol District
|
4
|
1
|
|
Salem District
|
17
|
1
|
|
Staunton District
|
11
|
12
|
« Back to intro screen
Bristol
- Bristol Area Overview
- Bristol Major Quantities
Bristol Major Quantities
|
Item
|
2024
|
2025
|
2026
|
2027
|
2028
|
|
Category
|
Item Description
|
Unit
|
Quantity
|
|
Drainage
|
Box Culvert (any size)
|
linear feet
|
0
|
0
|
0
|
0
|
0
|
|
Concrete Pipes Under 36"
|
linear feet
|
770
|
1,030
|
1,030
|
0
|
0
|
|
Concrete Pipes Over 36"
|
linear feet
|
290
|
390
|
390
|
0
|
0
|
|
Jacked & Bored Pipes Under 36"
|
linear feet
|
0
|
0
|
0
|
0
|
0
|
|
Jacked & Bored Pipes Over 36"
|
linear feet
|
0
|
0
|
0
|
0
|
0
|
|
Manhole & Inlets
|
linear feet
|
3
|
4
|
4
|
0
|
0
|
|
Endsection & Endwalls
|
linear feet
|
20
|
20
|
20
|
0
|
0
|
|
Curb and Gutter
|
linear feet
|
280
|
370
|
370
|
0
|
0
|
|
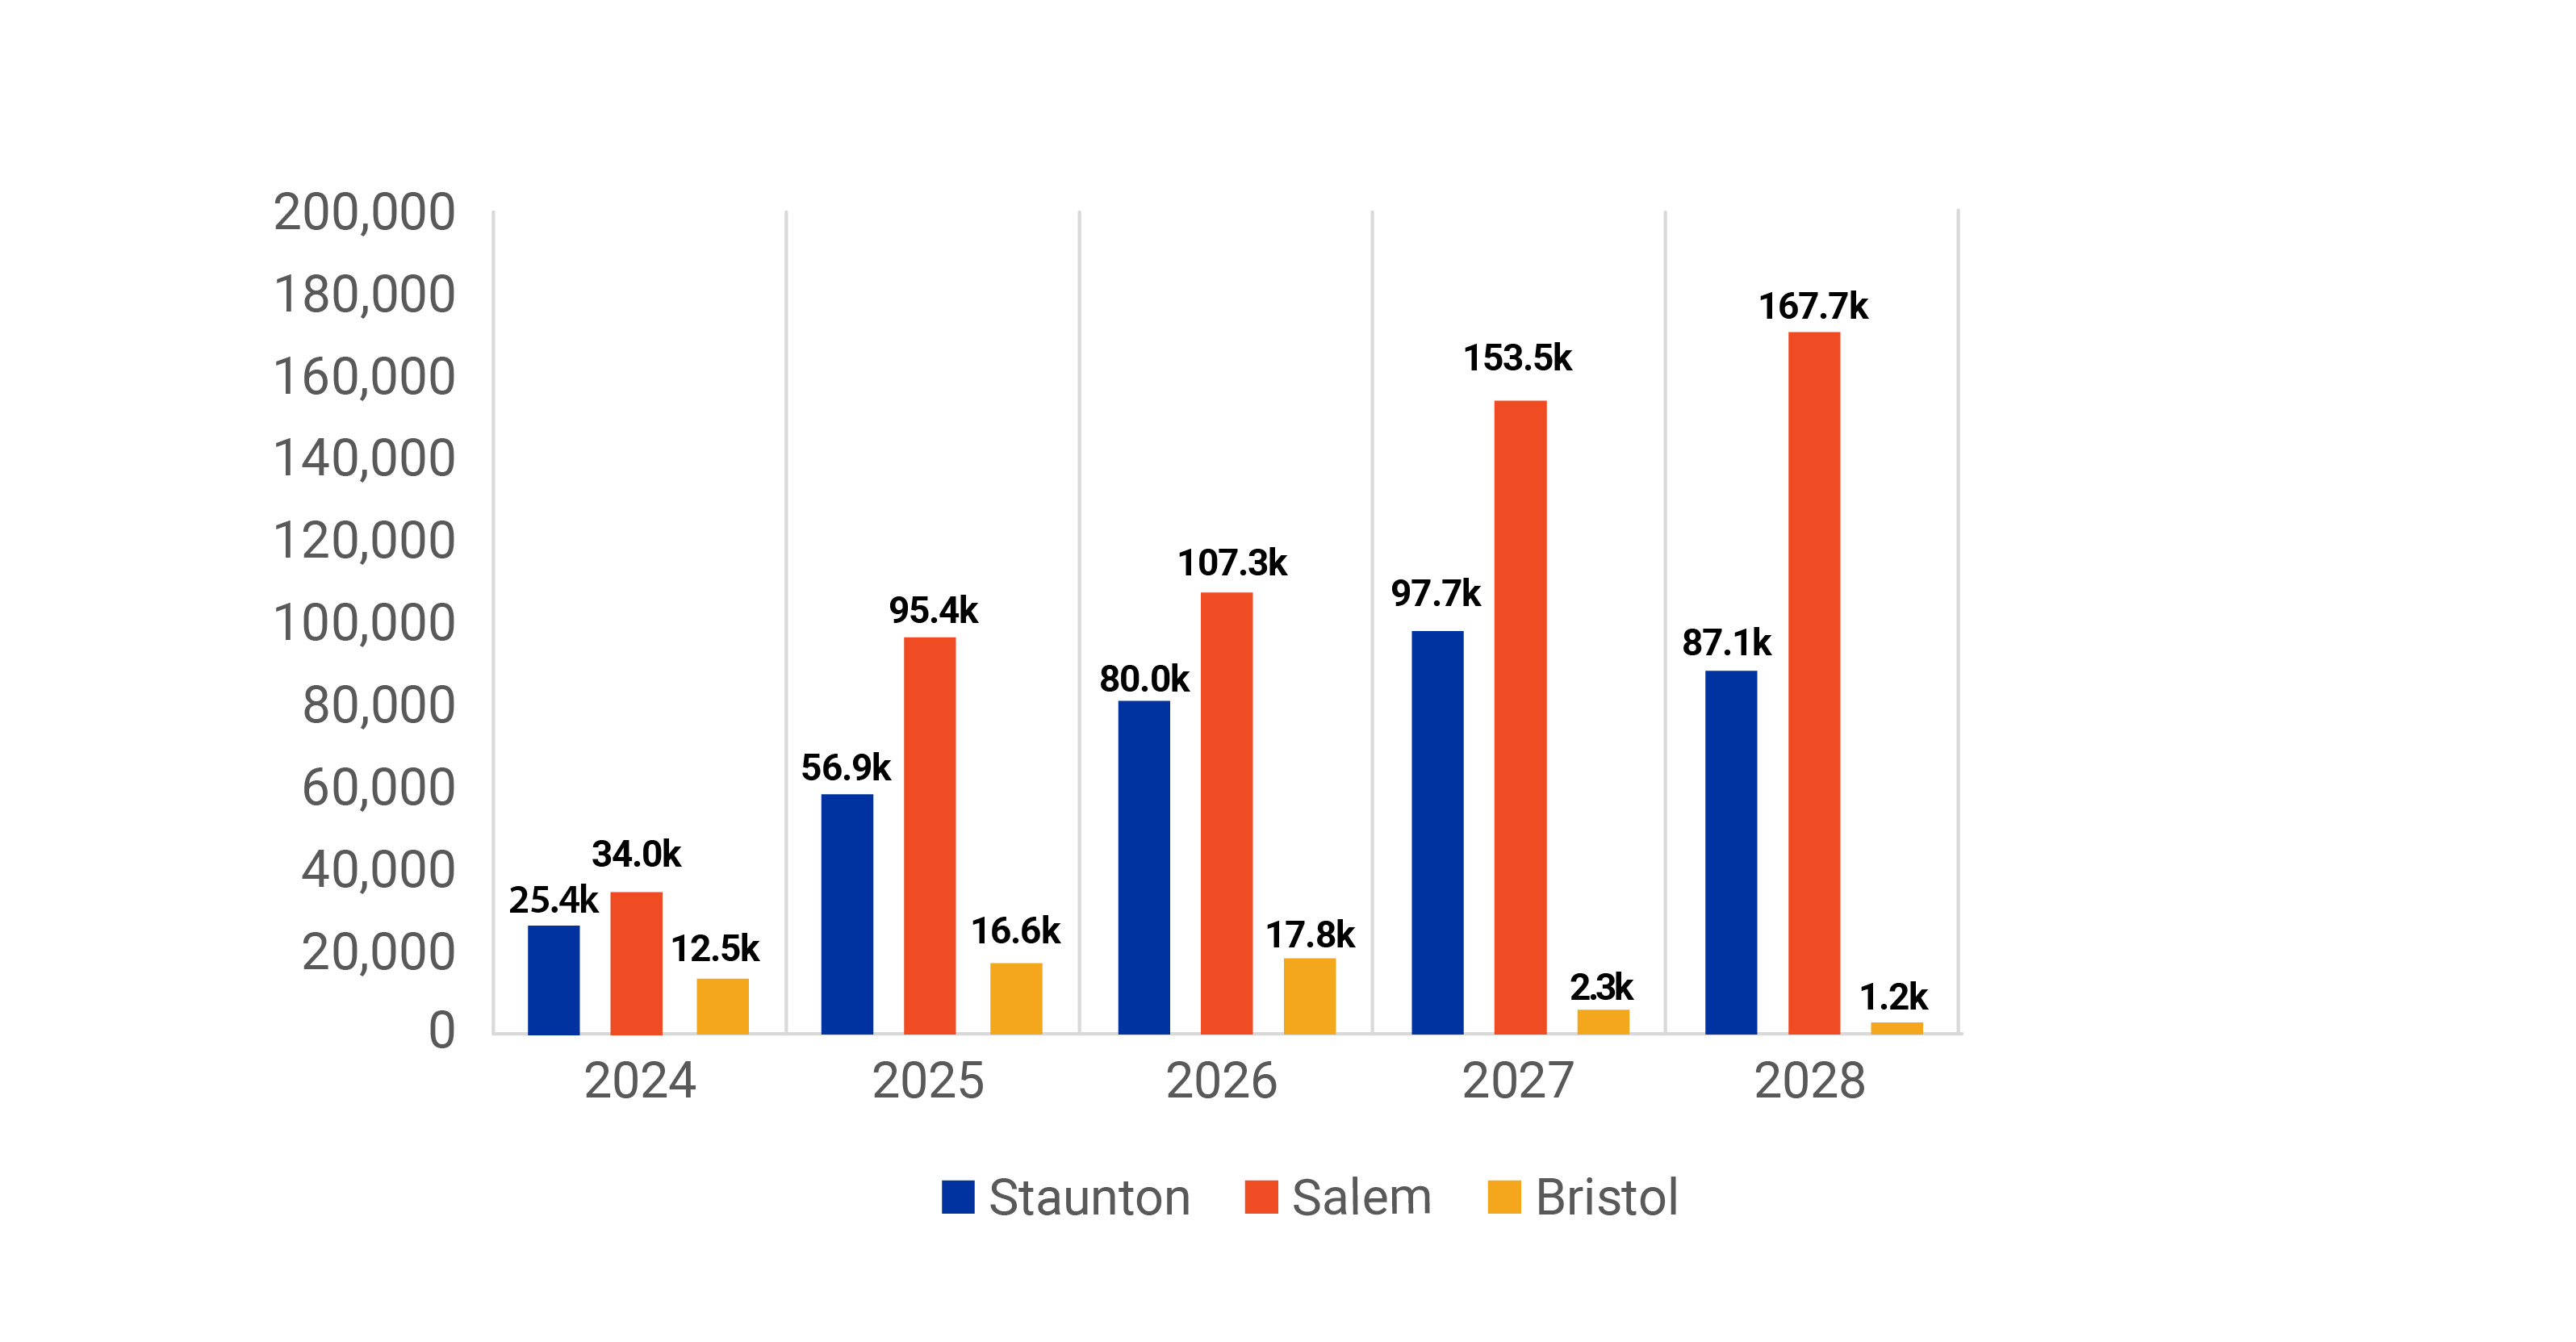
Pavement
|
Asphalt (any type)
|
ton
|
12,500
|
16,600
|
17,800
|
2,300
|
1,200
|
|
Aggregate
|
ton
|
23,700
|
31,600
|
40,300
|
17,500
|
8,800
|
|
Traffic and Safety
|
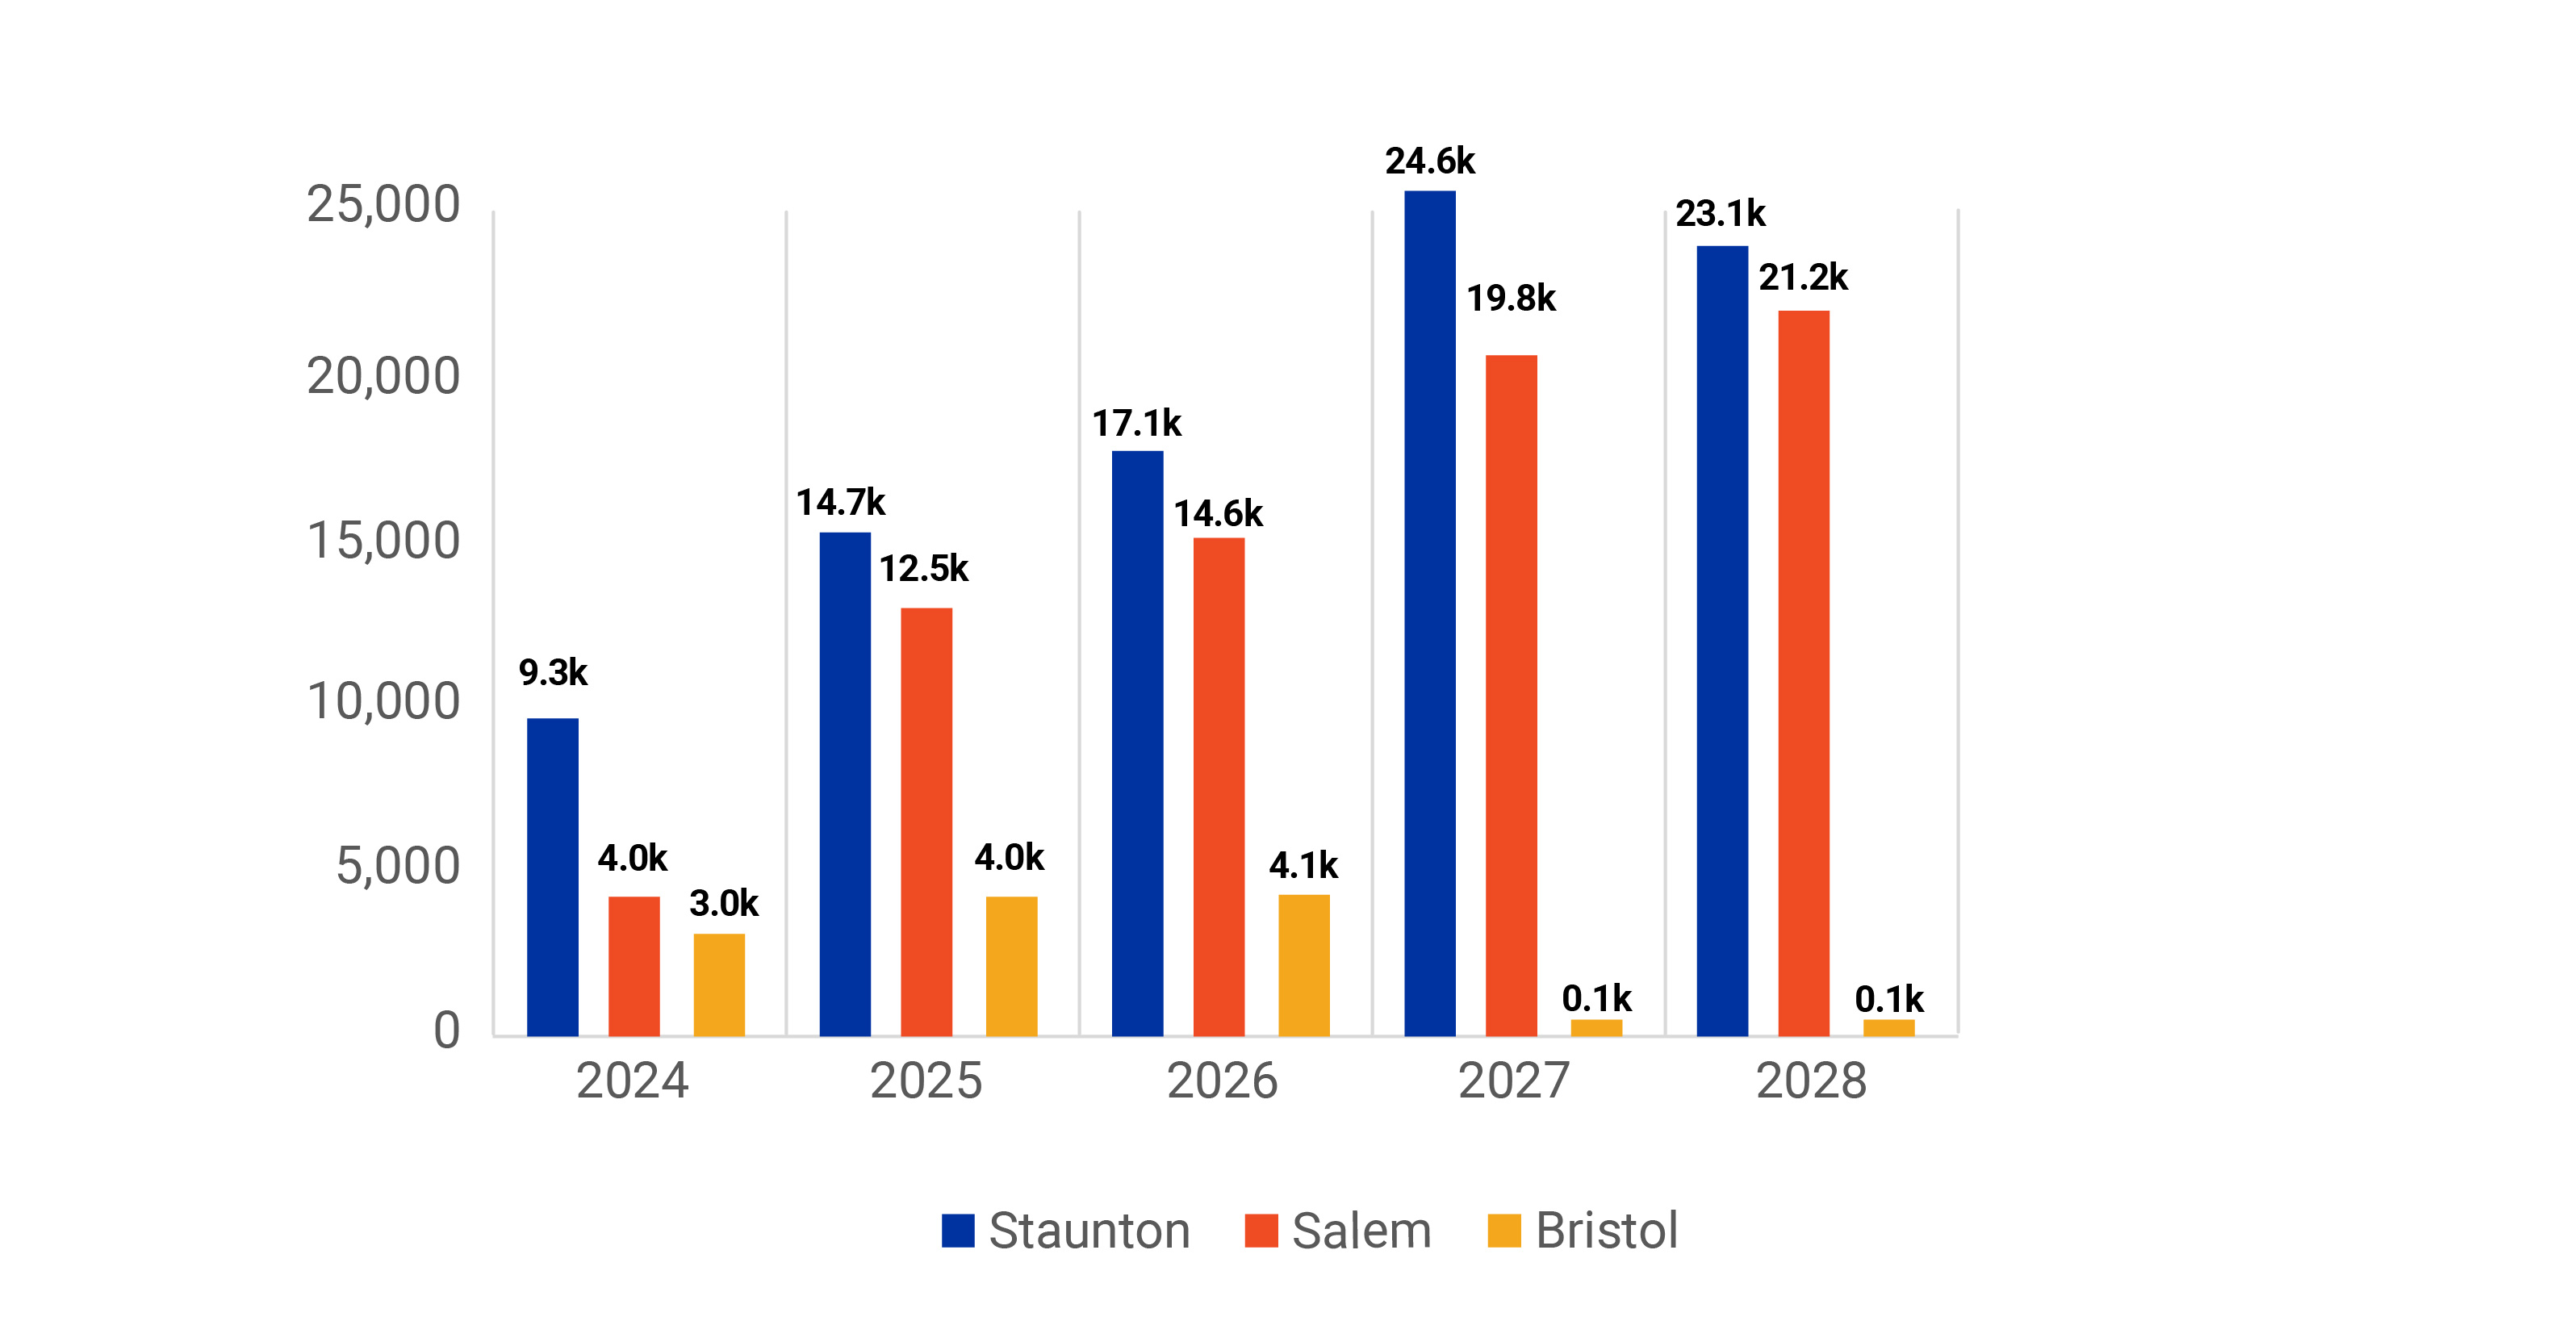
Guardrail (any type)
|
linear feet
|
3,000
|
4,000
|
4,100
|
100
|
100
|
|
End Treatment (any type)
|
linear feet
|
20
|
20
|
30
|
10
|
10
|
|
Concrete Barrier - Temporary
|
linear feet
|
17,700
|
0
|
1,300
|
0
|
0
|
|
Concrete Barrier - Permanent
|
linear feet
|
1,700
|
2,300
|
2,300
|
0
|
0
|
|
Structures
|
*Bridge (deck area)
|
square feet
|
14,000
|
18,700
|
20,700
|
3,900
|
2,000
|
|
Noise Barrier Wall
|
square feet
|
0
|
0
|
0
|
0
|
0
|
|
Retaining Wall
|
square feet
|
0
|
0
|
2,000
|
4,000
|
2,000
|
|
|
*Number of bridges for
|
|
Bridge Replacement
|
Bridge Widening
|
|
Bristol District
|
4
|
1
|
« Back to intro screen
Staunton
- Staunton Area Overview
- Staunton Major Quantities
Staunton Major Quantities
|
Item
|
2024
|
2025
|
2026
|
2027
|
2028
|
|
Category
|
Item Description
|
Unit
|
Quantity
|
|
Drainage
|
Box Culvert (any size)
|
linear feet
|
90
|
120
|
120
|
190
|
140
|
|
Concrete Pipes Under 36"
|
linear feet
|
1,160
|
4,830
|
8,100
|
8,610
|
7,920
|
|
Concrete Pipes Over 36"
|
linear feet
|
520
|
700
|
710
|
900
|
450
|
|
Jacked & Bored Pipes Under 36"
|
linear feet
|
50
|
210
|
350
|
380
|
370
|
|
Jacked & Bored Pipes Over 36"
|
linear feet
|
30
|
30
|
30
|
70
|
100
|
|
Manhole & Inlets
|
linear feet
|
20
|
60
|
100
|
110
|
100
|
|
Endsection & Endwalls
|
linear feet
|
30
|
50
|
50
|
60
|
30
|
|
Curb and Gutter
|
linear feet
|
230
|
1,020
|
1,940
|
1,940
|
1,910
|
|
Pavement
|
Asphalt (any type)
|
ton
|
25,400
|
56,900
|
80,000
|
97,700
|
87,100
|
|
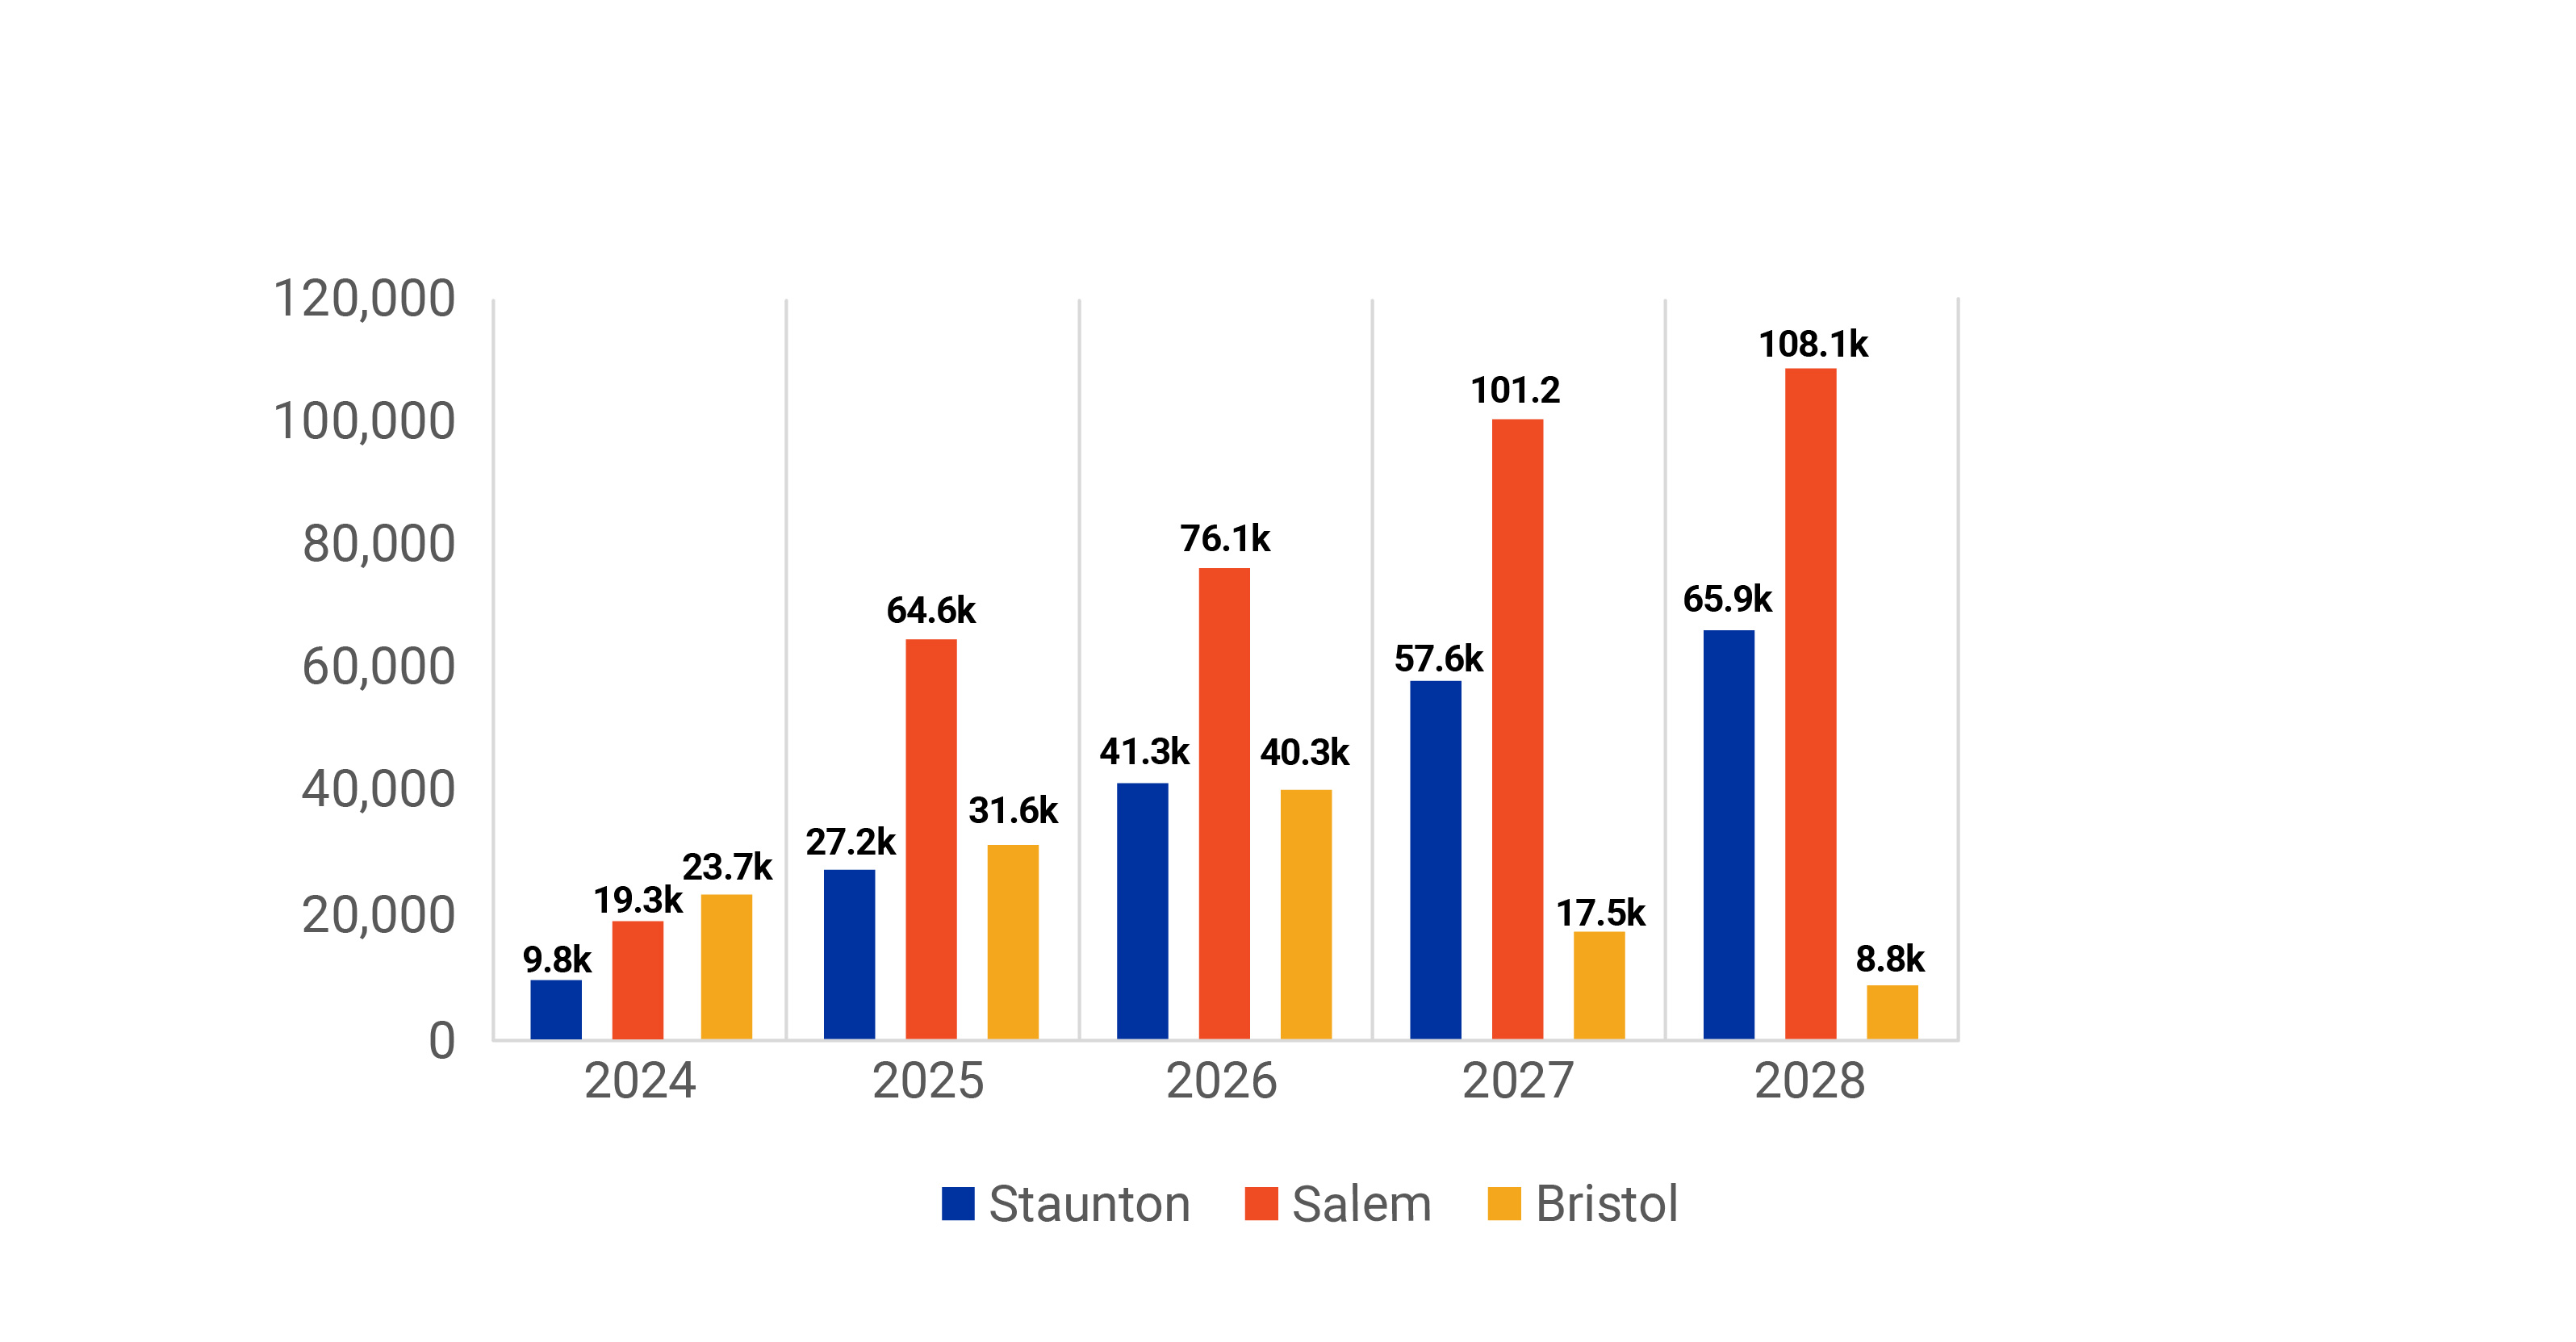
Aggregate
|
ton
|
9,800
|
27,200
|
41,300
|
57,600
|
65,900
|
|
Traffic and Safety
|
Guardrail (any type)
|
linear feet
|
9,300
|
14,700
|
17,100
|
24,600
|
23,100
|
|
End Treatment (any type)
|
linear feet
|
30
|
50
|
50
|
60
|
40
|
|
Concrete Barrier - Temporary
|
linear feet
|
68,100
|
158,300
|
0
|
81,100
|
0
|
|
Concrete Barrier - Permanent
|
linear feet
|
700
|
5,600
|
10,100
|
11,400
|
12,200
|
|
Structures
|
*Bridge (deck area)
|
square feet
|
13,000
|
28,200
|
39,000
|
57,300
|
64,100
|
|
Noise Barrier Wall
|
square feet
|
0
|
52,800
|
105,600
|
105,600
|
105,600
|
|
Retaining Wall
|
square feet
|
0
|
900
|
1,800
|
1,800
|
1,800
|
|
|
*Number of bridges for
|
|
Bridge Replacement
|
Bridge Widening
|
|
Staunton District
|
11
|
12
|
« Back to intro screen
Salem
- Salem Area Overview
- Salem Major Quantities
Salem Major Quantities
|
Item
|
2024
|
2025
|
2026
|
2027
|
2028
|
|
Category
|
Item Description
|
Unit
|
Quantity
|
|
Drainage
|
Box Culvert (any size)
|
linear feet
|
60
|
350
|
430
|
510
|
540
|
|
Concrete Pipes Under 36"
|
linear feet
|
3,820
|
11,990
|
13,540
|
18,910
|
20,650
|
|
Concrete Pipes Over 36"
|
linear feet
|
750
|
2,390
|
2,740
|
3,810
|
4,140
|
|
Jacked & Bored Pipes Under 36"
|
linear feet
|
90
|
270
|
300
|
420
|
460
|
|
Jacked & Bored Pipes Over 36"
|
linear feet
|
0
|
50
|
60
|
110
|
130
|
|
Manhole & Inlets
|
linear feet
|
40
|
120
|
140
|
180
|
200
|
|
Endsection & Endwalls
|
linear feet
|
20
|
60
|
70
|
90
|
100
|
|
Curb and Gutter
|
linear feet
|
360
|
1,210
|
1,610
|
1,940
|
1,940
|
|
Pavement
|
Asphalt (any type)
|
ton
|
34,000
|
95,400
|
107,300
|
153,500
|
167,700
|
|
Aggregate
|
ton
|
19,300
|
64,600
|
76,100
|
101,200
|
108,100
|
|
Traffic and Safety
|
Guardrail (any type)
|
linear feet
|
4,000
|
12,500
|
14,600
|
19,800
|
21,200
|
|
End Treatment (any type)
|
linear feet
|
10
|
30
|
40
|
50
|
50
|
|
Concrete Barrier - Temporary
|
linear feet
|
184,400
|
199,300
|
0
|
155,800
|
0
|
|
Concrete Barrier - Permanent
|
linear feet
|
3,500
|
8,000
|
9,300
|
13,700
|
14,700
|
|
Structures
|
*Bridge (deck area)
|
square feet
|
7,600
|
25,200
|
28,600
|
30,000
|
30,400
|
|
Noise Barrier Wall
|
square feet
|
15,800
|
80,200
|
96,500
|
118,600
|
125,900
|
|
Retaining Wall
|
square feet
|
2,400
|
4,800
|
4,800
|
8,200
|
9,300
|
|
|
*Number of bridges for
|
|
Bridge Replacement
|
Bridge Widening
|
|
Salem District
|
17
|
11
|
December 2023 Update – Data for planning purposes only, data subject to change.
Last updated: March 11, 2024